
March 06, 2007
Siebel Process Memory and CPU monitoring
How to Track Siebel CPU and memory use with VA2.
A problem most administrators of Siebel will run into whilst administering Siebel servers is that it is difficult to correlate the Siebel Server information from the tasks and server component views to the actual OS processes that support those components. So if a Siebel Administrator would like to track how much memory a component or task is using on a particular machine, several steps are required:
- For each process, open the Siebel Server log directory. A good place to start is the main Siebel Server log, you can open that and there will be entries which describe which PID (Process Id) was started for which component.
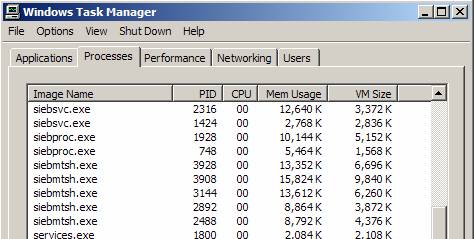
A common recommendation is to set up Windows perfmon for these particular PIDs, and determine whether they contain memory leaks or are using too much CPU. The problem with these recommendations is that there is a lot of manual work involved in harvesting process information from the log files, and that will prevent the automated monitoring of these components.
VA2 offers several key advantages to Siebel users who are trying to track the CPU and Process memory use for their Siebel components. The first is the out of the box graphs that correlates of Siebel Components to processes. In VA2 you have several views to your Siebel server component and task status. Because VA2 is written as a MMC Snap In, you will probably find it is faster to check Siebel Server status in VA2 rather than the Siebel screens.
This view shows the Component Status of Siebel Server Components.
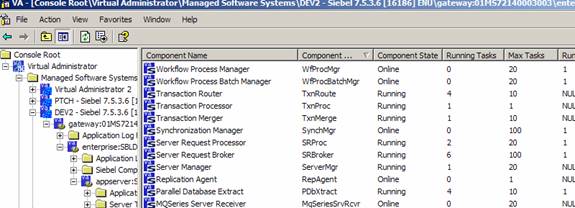
You can see the state of Workflow Process Manager component in the Siebel Server, including the Component State, the number of Running Tasks and Max Tasks. To determine which OS processes are actually supporting this component, Siebel recommends that you look in the Siebel server log file, and open up windows task manager. With VA2 however, you can right click on monitored components view to determine how much memory or CPU is used by which components.
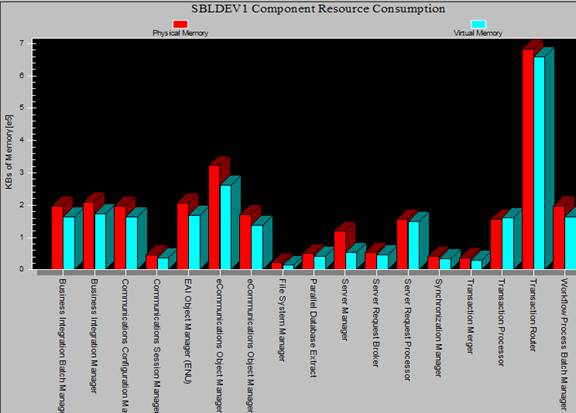
This view gives you a quick snapshot of how much virtual and physical memory the component groups are using in Siebel.
 .
.
A key VA2 feature is the correlation of processes running in the Siebel server. In the Siebel administration views, there are no administration views that show which processes are associated with a particular Siebel server. With VA2, you can navigate to the Processes tab under the appserver in question. In this case, we are looking at a Siebel server named SBLDEV2.
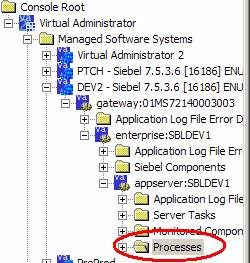
When selecting this view, a list of Siebel processes associated with various Siebel tasks and components will be displayed. No need to search through the log file.
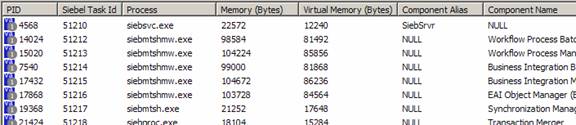
With this view, you can see that Workflow Process Manager component has spawned a process named siebmtsshmw.exe, with a PID of 15020. A listing of Memory and Virtual memory used for the component is available in the list view.
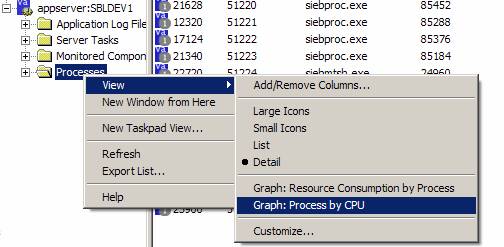
By choosing the View > Graph:Process by CPU option one can see how much CPU a Siebel processes are is using, useful for diagnosing the most heavily used parts of the Siebel Server. Memory graphs are available too.
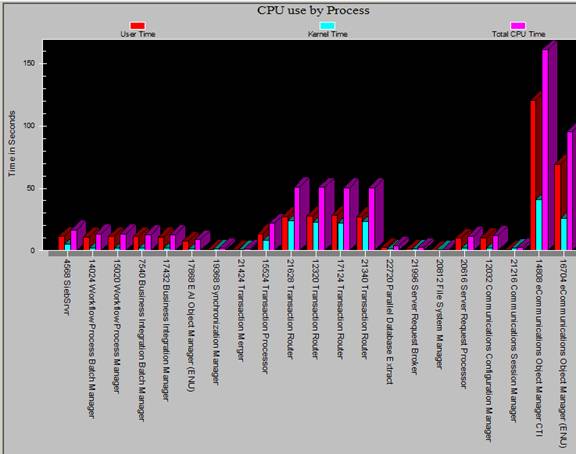
In this view, the CPU use of the CTI Object manager component is the most heavily used. The Kernel and User time is graphed.
So, for a quick visual check of the Siebel Server components and associated processes, the built in VA2 views and graphs are helpful. But what if you need monitor the memory or CPU use of Siebel components over extended period of time? Or respond with automated alerts or actions when you have memory or CPU constraint of a particular Siebel component? This can be especially important for diagnosing performance problems and impending outages of Siebel.
VA2 contains built in mechanisms for tracking data points, called Statistics. Because the Siebel Server processes and components are being captured at all times by VA2, graphing the memory and component use over time with VA2 is very easy.
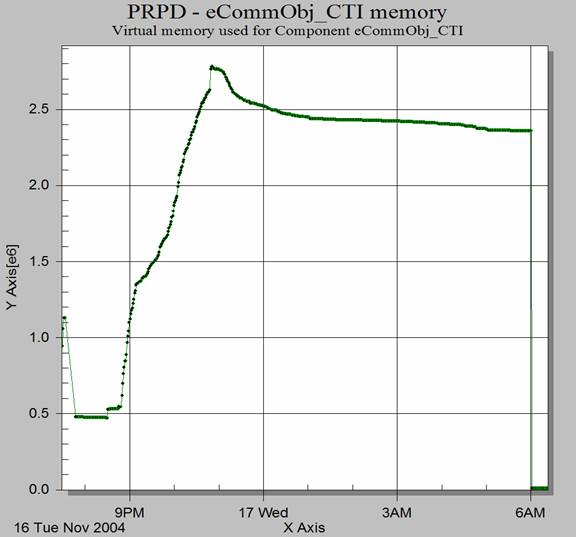
This view tracks a specific Siebel Component, eCommunications Object Manager. The object manager component has been customized by the client to support CTI functionality and its alias is eCommObj_CTI.
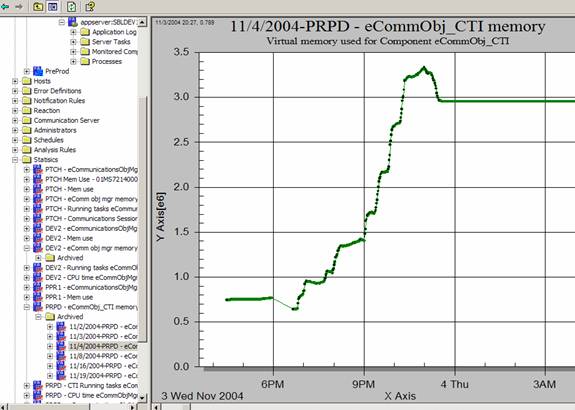
This graph shows that for all processes supporting the Siebel Object Manager in question used a little over .5 gig of virtual memory at around 6 pm. During the performance test, the amount of memory went up to almost 3.5 gigs of memory for these processes. A important part of VA2 is that it can track the memory and CPU of components at all times, instead of having to manually set up Windows performance metrics after digging through log files.
In addition, the graph shows what happens to the memory of the process after use. In this example, the virtual memory for the component is not released. But at least it flat lines. A memory leak for a component would continue to climb at all times. Furthermore, in production situations, the component should be monitored, as the amount of memory used by a component may get to a dangerous level dependent on the number of users.
CPU tracking
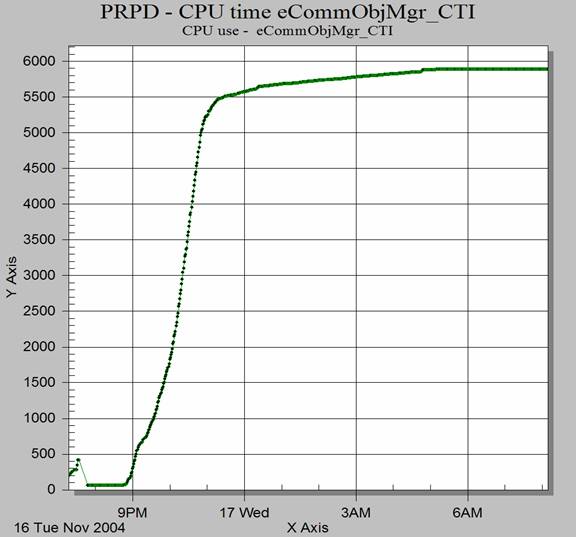
Another interesting area of the Siebel server that VA2 can easily track is the CPU use of individual components. Tracking the CPU use of individual components presents a similar challenge to tracking their memory use. You can try it manually, or use VA2 statistics to automatically graph and monitor the CPU use of Siebel processes. A particularly interesting area that is worth monitoring is whether the CPU use of a Siebel Object manager processes continues to climb after the users are no longer on it. If so, you have what I term a "CPU Leak". Basically, custom code in the processes can cause the process to hit 100% utilization, and performance will eventually deteriorate. This will be hard to diagnoses on a multi processor machine, but eventually will drag down performance.
Siebel Component Task tracking
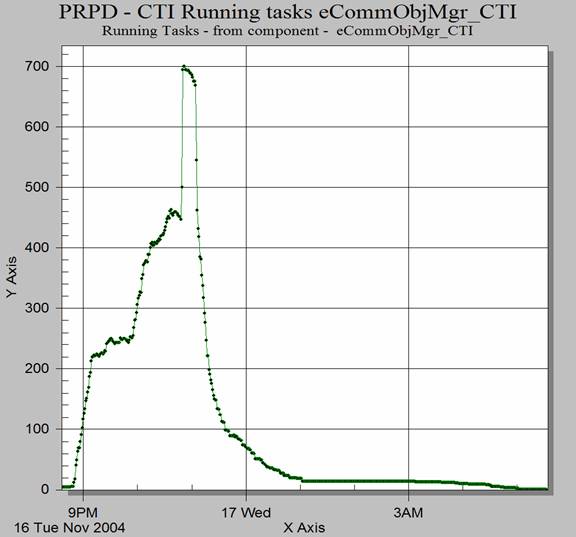
For Siebel Object manager components, each task listed by the component information represents one users session. So by tracking the total number of tasks the total number of users can be tracked on a system. Tracking number of tasks for Siebel object managers components across Siebel Servers is a key metric to determine if the components are being load balanced correctly. VA2 allows you to easily track the number of tasks being used for object manager components. Comparing that to memory and CPU at the same time periods allows administrators to gain a holistic view of Server performance. The following metrics are provided from a recent performance test.
Sample Test Results
# of CTI Tasks: Object manager tasks are the baseline for the test. The flat line is around 14 tasks. Some did not clean up until 4 in the morning.
CPU time, did not level off until 4 in the morning.
Memory use of CTI components: memory use does not follow drop of in CTI tasks.