
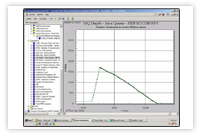
Statistics, historical trends
User defined system reportingUse any Perl modules to report on and analyse performance within Siebel or in any external system.
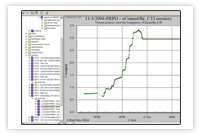 |
Use VA2 Statistics to create time series graphs of Siebel component memory and CPU use |
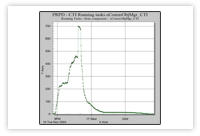 |
Track Siebel Users, number of tasks for components |
 |
VA2
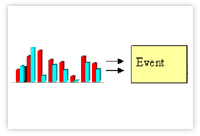
is 100% customizable. Use trending for any customPoint: - Perofrmance of database queries - Siebel Client HTTP performance - Custom Integration transaction flow - MQ Series depth - Number of days until Xmas 2007 (really.. You can graph - About anything) |
 |
The
first component of fixing system problems is Comparing conditions to historical
averages - React to deviations in tracked system trends with VA2 |